
Obstacle Detection in RGB images
One of the key goals of the IIMEO project is to automatically detect obstacles and potential risks along railway tracks. This is done by inspecting images of railway tracks to see whether railway tracks appear in an image at locations where they are supposed to be according to a railway track map.
How does it work?
The system follows a step-by-step approach to analyze images captured during flight.
Step 1: Deciding where to look
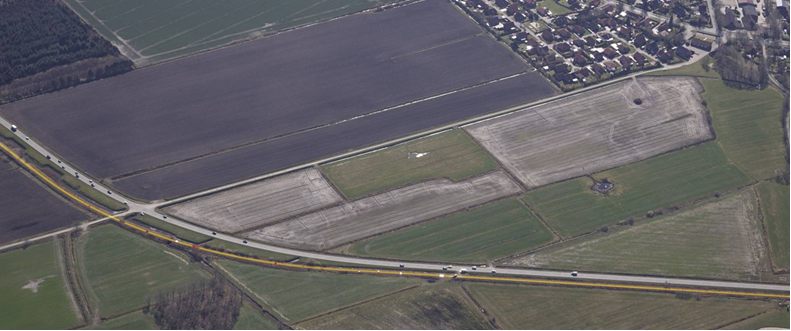
After taking a picture, that picture is combined with the position and attitude data of the flight platform in order to compute the geo-coordinates of each of the image’s pixels. Using a map of railway tracks, this information is used to determine which pixels are on or a small distance away of a railway track. All the other pixels are discarded; we wouldn’t find obstacles on railway tracks where there are no railway tracks in the first place. We keep the pixels a small distance away from the tracks though, because position- and attitude estimates as well as the track map might not be perfect but subject to small errors, which affect our computation regarding which pixels exactly show railway track.
Step 2: Finding Railway Tracks
The remaining image data is chopped up into smaller pieces, such that our on-board computer can use a neural network to determine which of the pixels we did not discard earlier show railway track and which do not and with what probability.
With these railway track detections in the image, we correct the relation between image pixels and geo-coordinates computed earlier, such that the geo-coordinate of a pixel classified as showing railway track is where a railway tracks is on the map. After that step, the relation between image pixels and geo-coordinates is a lot more accurate than the width („gauge“) of a railway track.
Step 3: Finding Obstacles on Tracks
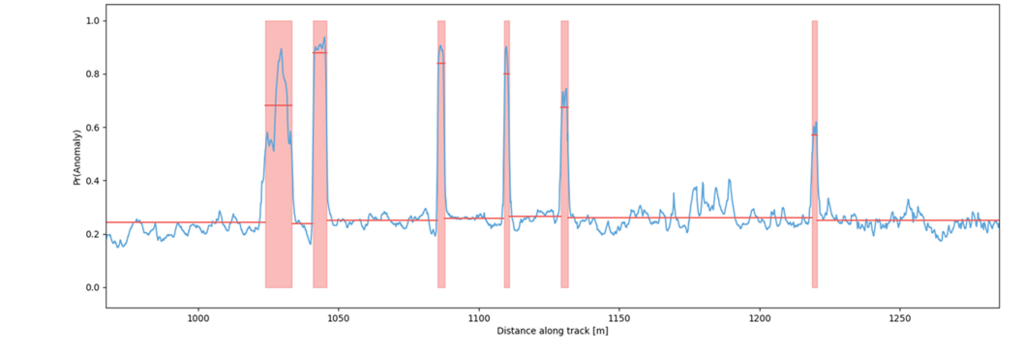
This now very accurate relation let’s us draw the railway tracks from the map on the image; while doing this, we record the this-pixel-looks-like-railway-track-probability computed using the neural network. For each recording, the distance from the start of the railway track is also computed, such that we get a good approximation of the function of looks-like-railway-track-probability at a distance.
Step 4: Storing and Combining Data from Multiple Sources
We break this function up into intervals where the looks-like-railway-track-probability is low, hence the there-is-an-obstacle-probability is high, and vice versa. This interval representation is less accurate, however only very little space is needed to store it and it is still relatively easy to combine it in a probabilistic manner with data extracted from other, overlapping images or even from SAR images – the latter being the final processing step.
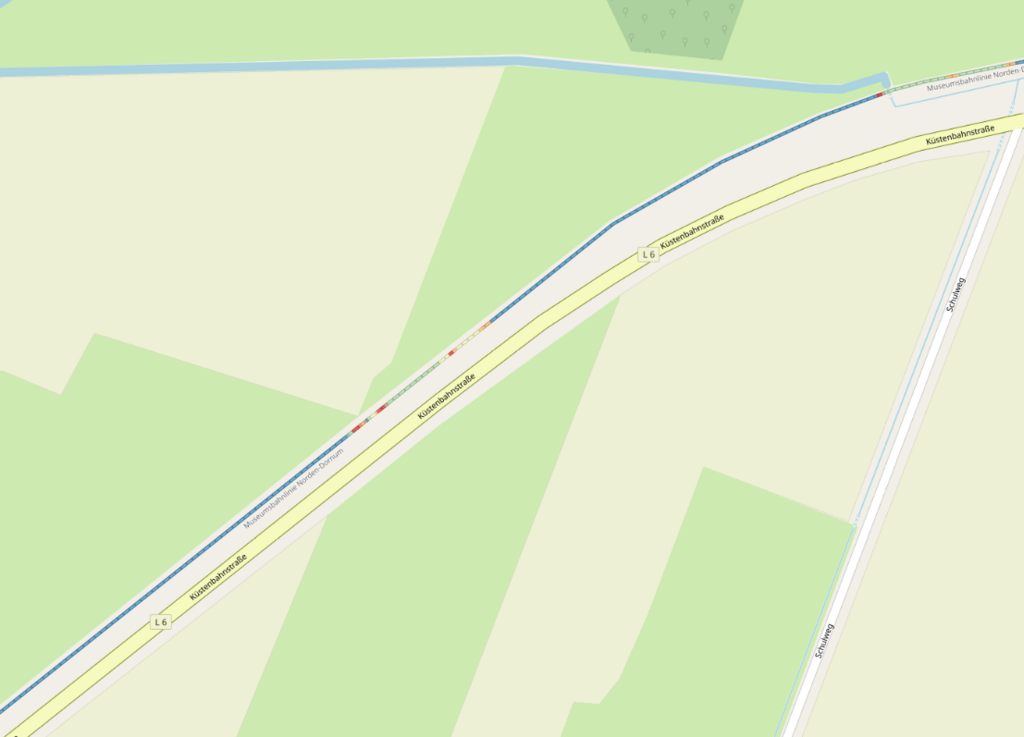
After the data is transmitted to ground, the intervals are drawn on a map coloured according to their obstacle probability.
What are the benefits?
By combining multiple steps into a single workflow, the system can:
- Detect potential hazards quickly
- Reduce the amount of data that needs to be transmitted
- Provide clear and actionable information
- Support safer and more efficient railway operations
Looking ahead
This intelligent obstacle detection approach demonstrates how advanced image analysis and artificial intelligence can transform raw data into valuable insights. It is a key step toward more automated and reliable infrastructure monitoring systems.